What Moves USD/JPY? BOJ, Fed Policy, and Moving Averages
Discover what really drives USD/JPY — from BOJ interest rate policy and Fed decisions to moving averages that help spot trends. Learn how to combine fundamentals and technicals to trade smarter.

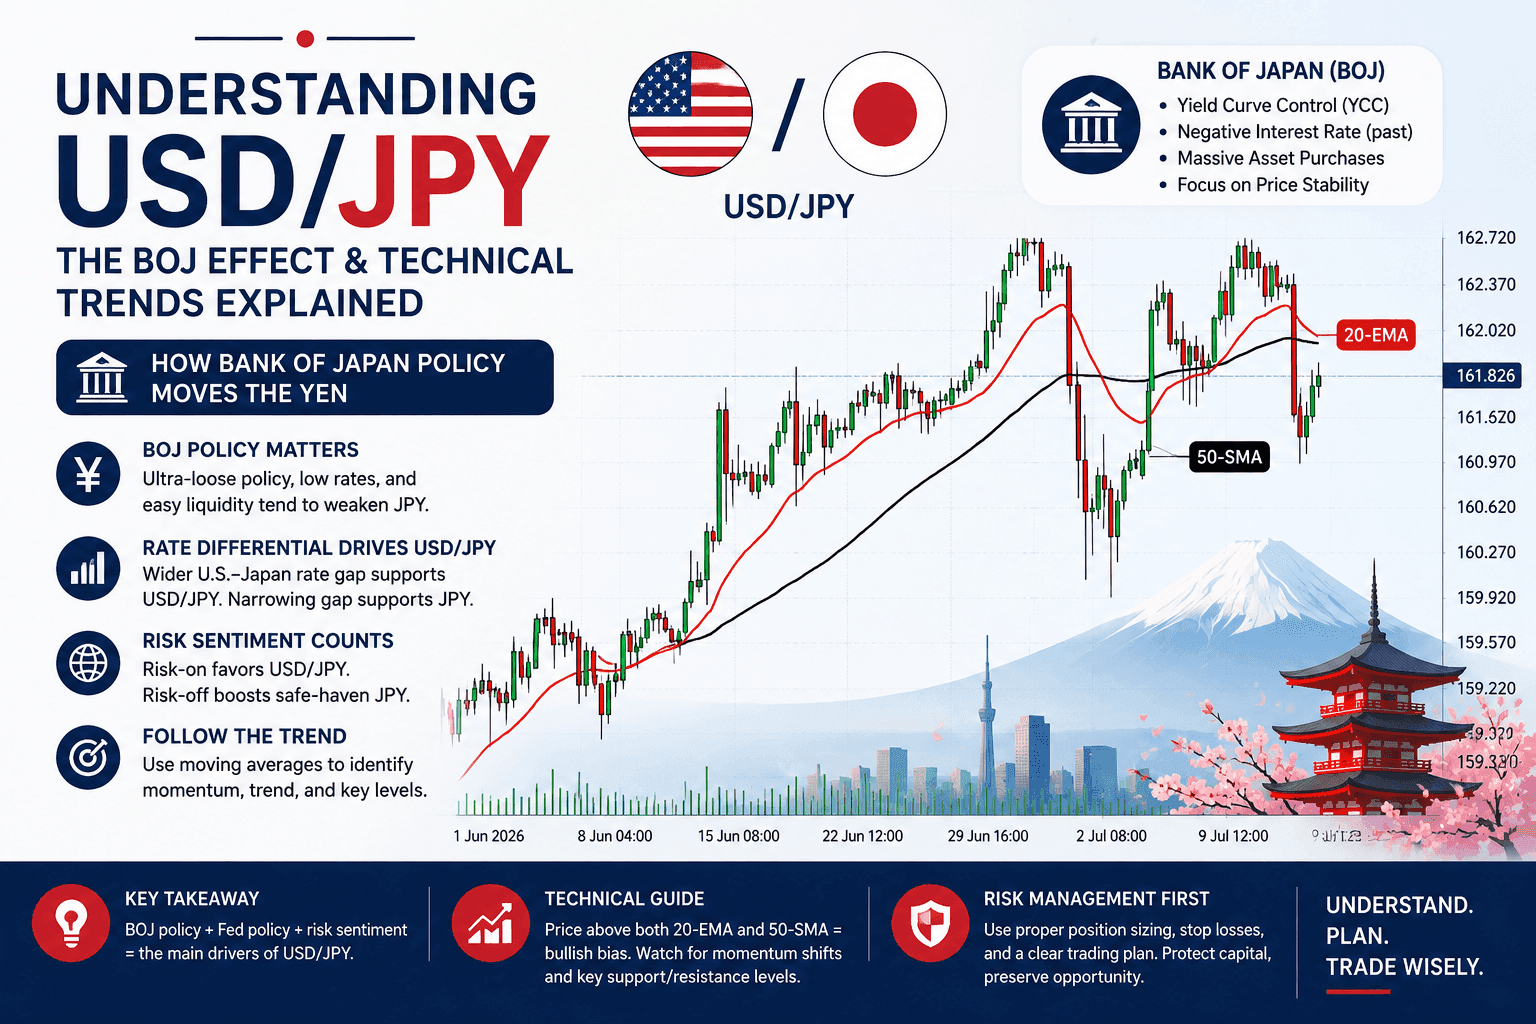
Why USD/JPY Is One of the Most Important Currency Pairs to Watch
The Economic Weight Behind the Dollar and the Yen
The United States and Japan together account for roughly a third of global GDP. That alone makes the exchange rate between their currencies consequential, not just for traders, but for central banks, multinational corporations, and sovereign wealth funds managing cross-border assets. When this pair moves, it tends to move with purpose and with volume behind it.
Daily average turnover in the global forex market exceeds $7.5 trillion (Bank of International Settlements, 2022 triennial survey), and USD/JPY consistently ranks as the second most traded pair worldwide, behind EUR/USD. That liquidity matters practically: spreads stay tight, orders fill cleanly, and the pair responds efficiently to news rather than gapping erratically.
What Makes USD/JPY Unique Among Major Forex Pairs
Most major currency pairs are shaped by two broadly similar central banks adjusting rates within a comparable range. USD/JPY is different. For decades, Japan's monetary policy has operated on a separate plane from the rest of the developed world, keeping rates near or below zero while the United States, Europe, and others moved through normal rate cycles. That structural divergence gives this pair a character all its own.
The yen also behaves as a safe-haven currency. During periods of global stress, investors tend to repatriate capital to Japan and unwind risk positions, which pushes the yen higher regardless of what domestic Japanese fundamentals look like. This means USD/JPY can move sharply on events that have nothing to do with either the Bank of Japan or the Federal Reserve: a geopolitical shock, a sudden equity selloff, or a credit event in an entirely different market.
Who Trades USD/JPY and Why It Matters for Retail Traders
Institutional desks, hedge funds, and Japanese exporters all participate heavily in this pair. Exporters in particular are consistent sellers of dollars (buying yen) as they convert overseas revenues, which can create recurring selling pressure at certain price levels. Understanding who else is in the market helps retail traders avoid fighting large, structural flows.
For traders on platforms like Rally Trade, the practical advantage is access. USD/JPY trades actively across all three major sessions. During the Tokyo session (midnight to 9:00 AM WAT), yen pairs tend to see their most Japan-specific price action. Volatility can then spike sharply again during the London-New York overlap (2:00 PM to 5:00 PM WAT) when U.S. data releases hit.
How Bank of Japan Policy Drives the Yen
The BOJ's History of Ultra-Accommodative Monetary Policy
Japan spent most of the 1990s dealing with deflation and stagnant growth following the collapse of its asset bubble. The BOJ's response was to cut rates aggressively and eventually experiment with unconventional tools before most other central banks had considered them. By the mid-2010s, Japan had negative deposit rates alongside a balance sheet that dwarfed those of its peers relative to GDP.
That history matters because it shaped how markets perceive the yen. The BOJ became associated with perpetual accommodation. Any signal of a policy shift, even a subtle one, tends to generate outsized yen moves precisely because markets have been pricing in inaction for so long.
Yield Curve Control and Large-Scale Asset Purchases Explained
In 2016, the BOJ introduced Yield Curve Control (YCC): a policy that targets the yield on 10-year Japanese Government Bonds (JGBs) rather than just a short-term rate. In practice, this meant the BOJ committed to buying as many JGBs as necessary to keep the 10-year yield within a specified band. The effect was to compress the entire yield curve and suppress the yen's appeal to yield-seeking investors.
Large-scale asset purchases (Japanese quantitative easing) work alongside YCC by expanding the money supply and keeping domestic financial conditions loose. Both tools functionally keep Japanese yields below those available in the United States, which has been the single most important structural reason USD/JPY trended higher through much of 2022 and 2023, reaching levels above 150 for the first time since 1990.
How BOJ Policy Signals Move USD/JPY in Real Time
In December 2022, the BOJ quietly widened its YCC band, allowing 10-year JGB yields to drift higher. USD/JPY dropped over 3% in a single session. No rate hike. No formal tightening. Just an adjustment to a yield target band. That reaction tells you everything about how sensitively this pair responds to BOJ communication.
Traders should read BOJ press conferences closely, not just for what is said but for tone. Phrases around "sustainable inflation" or "reviewing policy flexibility" are coded signals in Japan's notoriously cautious central bank communication. Markets have learned to front-run even small shifts in language.
The Federal Reserve's Role in Shaping USD/JPY
How U.S. Interest Rate Decisions Affect Dollar Strength
When the Federal Reserve raises its benchmark rate (the federal funds rate), U.S. Treasuries become more attractive relative to JGBs. Capital flows toward higher-yielding dollar assets, which increases demand for dollars and typically pushes USD/JPY higher. The 2022 Fed tightening cycle was one of the most aggressive in decades, with rates rising from near zero to above 5% within 18 months. USD/JPY moved from around 115 to over 151 during that period.
Rate cuts work in reverse. As the Fed eases, the yield advantage of holding dollars over yen narrows, which reduces the incentive to be long USD/JPY. But rate decisions alone don't move the market as much as the expectations built into prices ahead of the decision.
Forward Guidance and Economic Projections: Reading Between the Lines
The Fed publishes its "dot plot" four times per year, a chart showing where individual Federal Open Market Committee (FOMC) members expect rates to be in future years. When the median dot shifts meaningfully higher or lower, USD/JPY often moves before the actual rate change occurs. Markets price the future, not the present.
The same applies to language in the FOMC statement. A shift from "further policy firming may be appropriate" to "the committee will be patient in assessing" can move USD/JPY 80-100 pips within minutes of publication. This is why many traders reduce position size heading into FOMC meetings.
Why the Fed-BOJ Policy Divergence Is the Key Driver to Monitor
The spread between the U.S. 10-year Treasury yield and the Japanese 10-year JGB yield is probably the single cleanest leading indicator for USD/JPY direction over a medium-term horizon. When that spread widens in favour of U.S. rates, the pair tends to follow higher. When it narrows, watch for yen strength.
Plotting this yield differential alongside USD/JPY price action on a monthly chart is a useful exercise for any trader who wants to understand why the pair moves before relying on shorter-term technical signals.
Interest Rate Differentials and the Yen Carry Trade
What Is the Carry Trade and How Does It Work?
Borrow in a low-yield currency, invest in a high-yield one, pocket the difference. That is the carry trade in its simplest form. Japan's near-zero rates have made the yen the preferred funding currency for this strategy for over two decades. An institutional investor borrowing yen at 0.1% and investing in U.S. Treasuries yielding 5% earns approximately 4.9% annually before currency movement, which is substantial at scale.
Retail traders don't replicate this in the same way, but the aggregate effect of institutional carry positioning is clearly visible in how USD/JPY behaves during periods of stable, low-volatility markets. The pair tends to drift higher as carry demand builds.
How Widening and Narrowing Rate Gaps Move USD/JPY
A widening interest rate differential favours USD/JPY upside. As the Fed tightens while the BOJ holds steady, the carry becomes more attractive, drawing more capital into dollar assets funded by yen borrowing. This creates self-reinforcing upward pressure.
Narrowing differentials have the opposite effect. If the Fed signals cuts while the BOJ signals normalisation, the carry becomes less profitable or entirely uneconomic. Positions get closed. Yen is bought back to repay the original borrowing, and that buying can move USD/JPY lower quickly.
When Carry Trades Unwind: Yen Strength and Market Volatility
In August 2024, USD/JPY dropped approximately 12% in under three weeks following BOJ rate hike signals combined with a weak U.S. jobs report that raised recession fears. This was a carry trade unwind in action: risk-off sentiment met a narrowing rate differential, and the speed of the yen's appreciation surprised even experienced traders.
This is the asymmetry carry trades carry (unavoidably). The income accumulates slowly; the losses can happen overnight. Any trader holding long USD/JPY in trending markets should have a clear view on what the exit looks like if conditions shift.
Inflation Data and Global Risk Sentiment as Secondary Catalysts
How Japanese Inflation Figures Influence BOJ Policy Expectations
Japan spent three decades trying to generate meaningful inflation. When it finally arrived in 2022 and 2023, with core CPI (Consumer Price Index) reaching multi-decade highs above 3%, the implications for BOJ policy were significant. Markets began pricing in the possibility that sustained inflation would force the BOJ to normalise sooner than its language suggested.
Monthly releases of Japan's National CPI and Tokyo CPI (a leading indicator released earlier in the month) now move USD/JPY. A print above expectations raises speculation that the BOJ will act; a soft reading pushes that expectation back out. Neither outcome is automatic, but the market's sensitivity to these numbers has risen sharply since 2022.
U.S. CPI and PCE Reports: What Traders Should Watch
The U.S. Consumer Price Index (CPI) and the Personal Consumption Expenditures (PCE) price index are the Fed's primary inflation benchmarks. CPI is released monthly and tends to generate the larger immediate market reaction. The core PCE is released later but is the Fed's preferred measure for setting policy.
A U.S. CPI print that exceeds forecasts typically strengthens the dollar: it raises expectations for higher-for-longer Fed rates, widening the differential with Japan. A miss does the opposite. Position yourself accordingly around these release dates, or reduce exposure if you're not prepared to manage the volatility they can produce.
Risk-On vs. Risk-Off Environments and Their Effect on the Yen
The yen's safe-haven status means USD/JPY doesn't always follow the rate differential narrative. During the COVID-19 market shock in March 2020, USD/JPY actually fell sharply as investors unwound risk positions globally, buying yen despite near-zero rates in Japan. Risk appetite, as proxied by equity market performance and volatility indices (like the VIX), can temporarily override the fundamental interest rate story.
Watching global equities alongside USD/JPY can provide useful context: consistent equity strength often coincides with yen weakness, while a sharp equity selloff frequently produces yen buying.
Using Moving Averages to Analyze USD/JPY Price Action
The 20-Period EMA: Tracking Short-Term Momentum
A trader watching USD/JPY on the daily chart sets up a 20-period Exponential Moving Average (EMA). The EMA places more weight on recent closes, making it faster to respond than a simple average. When price holds above the 20-EMA over consecutive sessions, it suggests short-term buying pressure is sustaining. When price breaks below and stays below, momentum has shifted.
The 20-EMA works well in trending conditions. In ranging markets, price will repeatedly cross the average in both directions without producing meaningful follow-through. This is why treating any moving average signal in isolation is a mistake that costs traders real money.
The 50-Period SMA: Identifying the Intermediate Trend
The 50-period Simple Moving Average (SMA) moves more slowly and filters out the noise that the 20-EMA picks up. On the daily chart, the 50-SMA roughly represents two and a half months of price action. A pair trading consistently above it is generally in an uptrend; below it suggests a broader downtrend.
On the weekly chart, the 50-SMA becomes a much longer-term reference point. During the 2021-2022 USD/JPY bull run, price broke above the weekly 50-SMA in late 2021 and didn't look back for over a year. Traders who used that level as their trend bias filter avoided being caught selling into a historically strong trend.
Reading Crossovers and Price Position as Trend Confirmation Tools
When the 20-EMA crosses above the 50-SMA (a "golden cross" pattern), it signals that short-term momentum is aligning with the intermediate trend. The reverse crossing (20-EMA below 50-SMA) can signal deteriorating momentum. These crossovers are useful, but they are lagging by definition: the cross happens after the price has already moved.
Use them as confirmation, not as entry triggers. If you're already watching USD/JPY based on a fundamental view (say, a widening Fed-BOJ differential), a bullish crossover gives you technical alignment to consider timing an entry. Don't use the crossover as the reason to trade; use it as part of the reason.
Aligning Moving Average Signals with BOJ and Fed Fundamentals
If price is above both the 20-EMA and 50-SMA on the daily chart while the Fed-BOJ policy divergence is widening, the technical picture and the fundamental backdrop are pointing in the same direction. That confluence is what traders should look for. Neither signal alone is sufficient.
The dangerous scenario is when technicals point one way and fundamentals are shifting the other. A bullish moving average setup during a period when BOJ hawkish surprises are becoming more frequent is fragile. At that point, risk management isn't optional.
Risk Management When Trading USD/JPY
Why Fundamental Shifts Can Override Technical Setups
Consider a long USD/JPY trade entered on a textbook 20-EMA and 50-SMA crossover in late July 2024. The setup looked clean. Fundamentals appeared supportive. Then the BOJ surprised markets with a rate hike while U.S. employment data disappointed simultaneously. The pair dropped over 1,000 pips in days. The technical setup didn't fail; it became irrelevant.
This is not an argument against technical analysis. It is an argument for sizing positions in a way that an unexpected fundamental shock doesn't eliminate the account.
Position Sizing and Stop-Loss Placement for Volatile Yen Moves
USD/JPY can move 150-200 pips on a high-impact news day. Stops placed too tightly get taken out by noise before the trade has time to develop. Stops placed too loosely expose the account to excessive loss on a single position.
A practical approach: don't risk more than 1-2% of your account on any single USD/JPY trade. If your account is ₦500,000 and you're risking 1.5%, that's ₦7,500 maximum loss per trade. Work backward from that number to determine your position size based on where your stop makes technical sense, not the other way around.
Building a Disciplined Trading Plan Around High-Impact Events
Know the calendar before you know the trade. USD/JPY is directly sensitive to BOJ meetings (typically 8 per year), FOMC decisions (8 per year), U.S. CPI, U.S. Non-Farm Payrolls, and Japanese CPI. Before any of these events, decide in advance: will you hold your position through the release, reduce it, or exit entirely?
Many experienced traders take one of two clear positions: either they're comfortable with the risk of holding through data and have sized accordingly, or they're not and they close before the release. The costly middle ground is holding a full position through a high-impact event without a defined plan for what happens next.
Start Analyzing USD/JPY with Confidence on Rally Trade
How Rally Trade Supports Your USD/JPY Trading Journey
Rally Trade provides access to USD/JPY on MT5 platform with competitive spreads and the full range of charting tools needed to apply the technical framework covered here. The 20-EMA and 50-SMA are standard indicators that can be applied directly to any USD/JPY chart in seconds.
Beyond the tools, Rally Trade's copy trading feature allows traders who are still developing their fundamental analysis skills to observe how experienced traders respond to BOJ and Fed events in real time. This is valuable context that takes time to build independently. Copy trading carries its own risks, and past performance from any strategy provider does not guarantee future results, but the observational benefit of watching experienced execution during high-volatility events is real.
Putting It All Together: A Framework for Informed Decision-Making
USD/JPY is shaped by the interaction of BOJ policy, Federal Reserve decisions, the yield differential between the two countries, inflation dynamics in both economies, and the broader state of global risk appetite. Moving averages like the 20-EMA and 50-SMA help traders read the technical narrative that emerges from those fundamentals in price.
The framework is not complicated. Monitor the Fed-BOJ policy gap. Watch the U.S.-Japan yield spread. Track Japanese and U.S. inflation data around release dates. Use moving averages to identify trend direction and look for alignment between the technical picture and the fundamental backdrop before considering a trade. Manage risk on every position without exception.
USD/JPY will continue to be one of the world's most actively traded pairs precisely because the forces shaping it are consequential, persistent, and regularly surprising. That combination creates opportunity. It also demands respect.
Trading involves significant risk and is not suitable for all investors. Past performance is not indicative of future results. Only trade with funds you can afford to lose. Ensure you fully understand the risks involved with leveraged products, including the possibility of losing more than your initial deposit, before committing capital.
Frequently Asked Questions
How does BOJ policy affect the USD/JPY exchange rate?
×
The Bank of Japan's monetary policy directly influences the value of the yen by affecting interest rate differentials between Japan and the United States. When the BOJ maintains low or negative rates while the Federal Reserve holds rates higher, the gap tends to weaken the yen and support USD/JPY. Any shift toward BOJ policy normalization — such as raising rates or reducing asset purchases — can cause the yen to strengthen sharply, pushing USD/JPY lower.