Supply and Demand Zones in Forex: How to Trade Them
Learn how supply and demand zones reveal where big money buys and sells in Forex. Discover how to draw demand and supply zones, plan entries and stops, and how they differ from order blocks.

Why Supply and Demand Zones Matter in Forex Trading
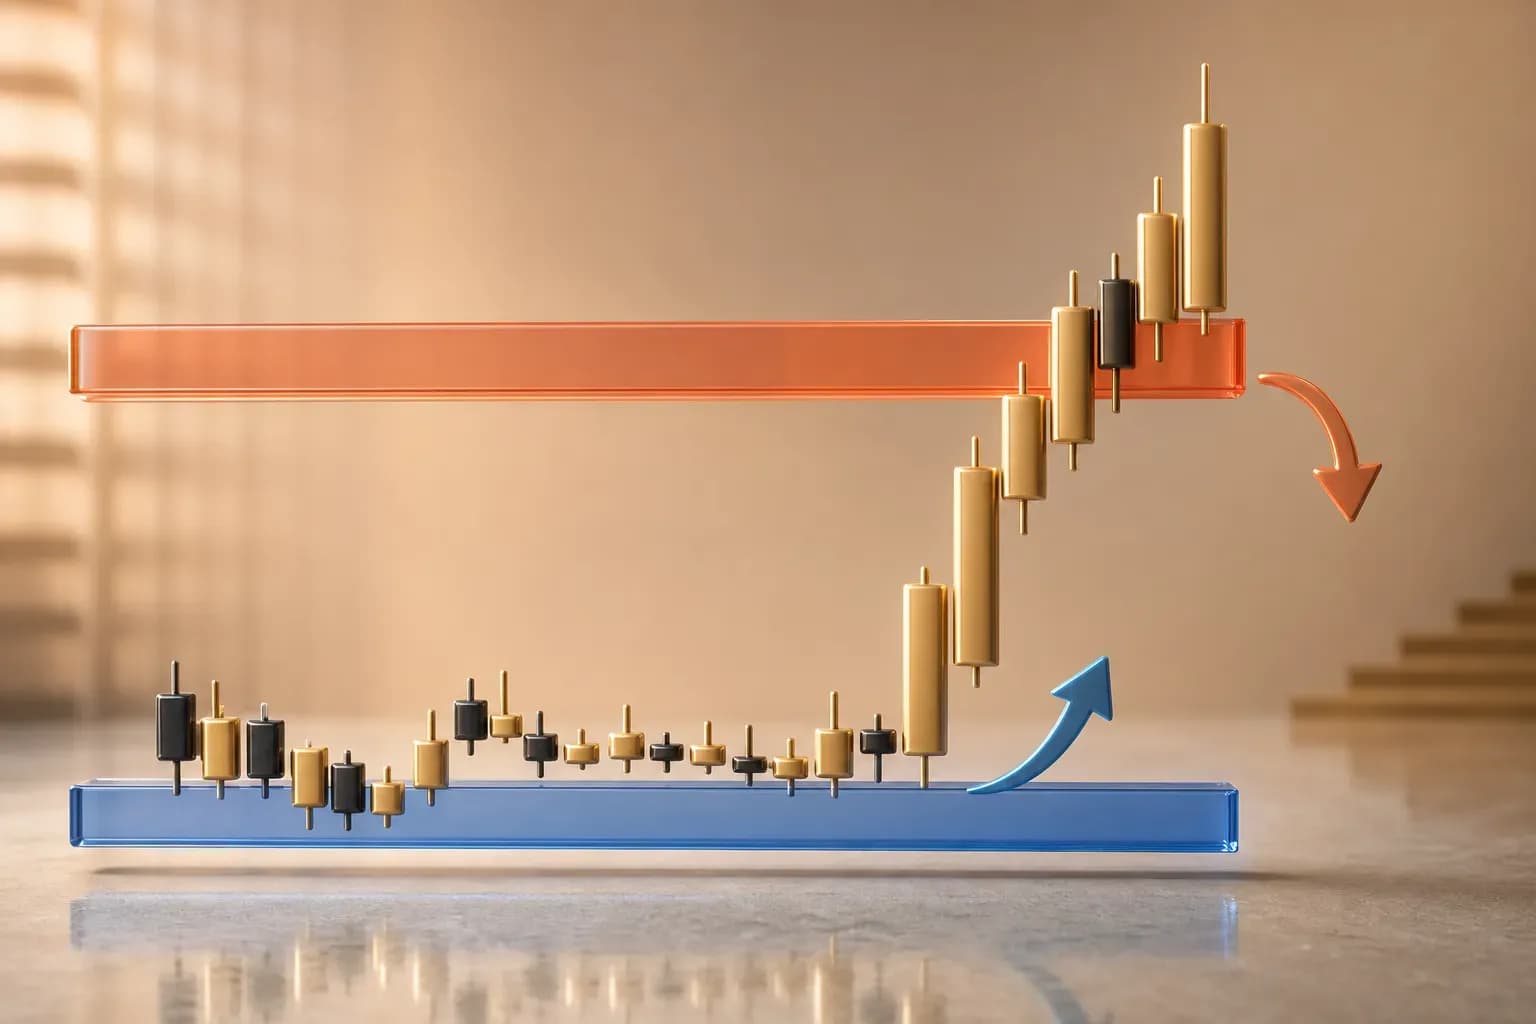
Price doesn't move randomly. It moves because someone is buying or selling in volume, and those large orders leave footprints on the chart. Supply and demand zones are how you read those footprints. Learn to spot them and you stop chasing candles; you start anticipating where price is likely to react before it gets there.
Most beginners draw a single horizontal line and call it support. Then they watch price slice straight through it and wonder what went wrong. A zone is different. It's an area, a range of prices where big buying or selling once overwhelmed the market, and where it may do so again. That distinction changes how you enter, where you place your stop, and how you manage the trade.
This is a core piece of supply and demand trading, and it sits at the heart of what many traders now call smart money concepts. You don't need expensive software or insider data. You need a clean chart, some technical analysis for beginners, and the patience to mark zones properly.
What Are Supply and Demand Zones?
A supply zone is a price area where selling pressure was strong enough to push price sharply down. A demand zone is the opposite: a price area where buying pressure launched price sharply up. Both mark spots where the balance between buyers and sellers tipped hard in one direction.

Think of it as a memory the market keeps. When price returns to a zone where a big move originated, there's a reasonable chance that leftover orders are still sitting there, waiting to be filled.
Understanding the Supply Zone
A supply zone forms at the top of a move, just before price falls. Sellers here outnumbered buyers by a wide margin, and the imbalance sent price tumbling. On GBP/USD, imagine price grinding upward, stalling in a tight cluster of candles around 1.2750, then dropping 120 pips in three candles. That tight cluster before the drop is your supply zone.
When price later climbs back to that area, sellers who couldn't fill all their orders the first time may step in again. That's the theory. It doesn't always play out, but often enough to be tradable.
Understanding the Demand Zone
The demand zone is where price bottomed and rocketed higher. Buyers absorbed all the selling, then pushed price up with force. Picture EUR/USD sitting flat near 1.0820 for a few candles, then jumping 90 pips into the London session. That flat base is your demand zone.
Return visits to a demand zone are where buy setups tend to form. The stronger and faster the original move away, the more respect the zone usually earns.
How Zones Differ From Ordinary Support and Resistance
Support and resistance are lines. Zones are ranges. That's the surface difference, but the logic underneath matters more.

Traditional support assumes price stops at an exact level, which almost never happens cleanly. Price overshoots, wicks, and fakes people out. A zone gives you a band of prices to work with, so a small overshoot doesn't automatically stop you out. You're also looking for a specific event: a sharp, imbalanced move away from the area. Ordinary support is just a spot price bounced off before, with no requirement that the move away was violent. Zones demand evidence of a real imbalance, and that filter alone cuts out a lot of weak levels.
How Supply and Demand Zones Form on the Chart
Every strong zone starts the same way: price consolidates in a small range, then explodes out of it. The consolidation is where large orders accumulate. The explosion is the imbalance being resolved. No consolidation, no zone worth trading.
Daily forex turnover crosses $7.5 trillion (Bank for International Settlements 2022 triennial survey). Institutions moving size can't fill a huge position at one price without moving the market against themselves, so they build positions quietly in these tight ranges, then let the imbalance do its work.
The Role of Unfilled Orders and Smart Money Concepts
Here's the mechanism smart money concepts are built on. When a large buyer wants 10,000 lots but only 6,000 sell orders are available at their price, price shoots up before the rest can fill. Those 4,000 unfilled orders don't disappear. They may sit at that price, waiting.
When price drifts back down to the demand zone, those resting buy orders can activate, pushing price up again. Same logic in reverse for a supply zone and unfilled sell orders. This is the order blocks in forex idea in plain terms: a candle or cluster where institutional orders originated and may still be parked.
Do you know exactly how many orders remain? No. Nobody does. You're reading probability, not certainty.
Signs of a Strong Move Away From a Zone
Not every zone is equal. A weak departure gives a weak zone. Look for these clues that a zone is worth marking:

- Speed. Price left the area in a few large candles rather than drifting away slowly over twenty. Fast moves suggest a genuine imbalance.
- Distance. The move covered a meaningful range before pausing, say 80 to 150 pips on a major pair rather than a limp 20.
- A fresh zone, one price hasn't returned to yet, tends to be more reliable than one that's already been tested two or three times. Each test consumes some of those resting orders.
How to Draw a Demand Zone Step by Step
Find the base, mark the boundaries, wait. Three steps, and the first one does most of the work.

Finding the Base Before the Rally
Scroll back on your chart and look for the strongest bullish moves. At the origin of each, you'll usually see a short pause: a few small candles clustered together before the rally began. That cluster is the base. On the Rally Trade platform, drop to the 1-hour or 4-hour chart for cleaner bases; the 5-minute chart gives you too many, most of them noise.
Ignore rallies that started from nothing. If price was already climbing steadily and just kept going, there's no clean base to mark.
Marking the Zone Boundaries Correctly
Draw a rectangle. The bottom edge sits at the lowest low of the base candles. The top edge sits at the open of the first big candle that broke away (or the top of the base bodies, depending on which method you prefer; the body method gives tighter zones).
Keep the zone tight. A demand zone stretched across 100 pips isn't a zone, it's a wish. If your base is genuinely that wide, you're probably looking at the wrong candles. Extend the rectangle to the right so you can see when price returns to test it.
How to Draw a Supply Zone Step by Step
Finding the Base Before the Drop
Same process, flipped. Find the sharpest bearish moves and look at where they began. You want a small cluster of candles that formed just before price collapsed. That's the supply base.
On USD/JPY, if price stalled around 151.20 for four candles and then dropped 130 pips, those four candles are your zone. Mark the top edge at the highest high, the bottom edge at the base of the bodies or the open of the breakout candle.
Common Mistakes When Drawing Zones
The biggest error is drawing zones after the fact to fit price you've already seen. Everyone can find perfect zones in hindsight. The skill is marking them before price returns.
Second mistake: making zones too wide because you're afraid of being wrong. A wide zone technically "works" more often, but your stop-loss becomes so large the risk isn't worth it. Third: ignoring the higher timeframe context. A demand zone means little if the overall trend is grinding down hard against it. Draw zones, yes, but read the direction of the larger move first.
How to Trade Supply and Demand Zones
Planning Your Entry at the Zone
You have two entry styles. The first is a limit order placed at the zone edge, so you're filled automatically when price arrives. The second is waiting for price to reach the zone and show a reaction (a rejection wick, a bullish engulfing candle at a demand zone) before entering manually.
Limit orders get you the best price but no confirmation. Manual entries give confirmation but a worse price and sometimes a missed trade. Beginners are usually better served waiting for a reaction; it filters out zones that fail on the first touch.
Placing Your Stop-Loss and Take-Profit
Your stop-loss goes just beyond the far edge of the zone. For a demand zone, that means a little below the bottom edge. If price closes through the zone, your reason for being in the trade is gone, so there's no sense holding.
Take-profit targets the next opposing zone. If you buy at a demand zone, aim for the next supply zone above. That gives you a defined risk-to-reward ratio you can measure before you ever click buy. Aim for at least 1:2, meaning you risk one to make two.
Trading Bounces vs Trading Breaks
Most zone trading is bounce trading: you expect price to reverse at the zone. But zones break, and breaks tell you something too.
When a demand zone breaks cleanly and price closes well below it, that failed zone can flip into supply on the retest. This works well in trending markets where the dominant direction keeps overpowering weaker zones. In choppy, ranging conditions, break trades get chopped up badly, so the bounce approach usually suits ranges better.
A Naira-Based Risk Example
You deposit ₦400,000 (roughly $250) into a Rally Trade account. You decide to risk 1% per trade, which is ₦4,000. You spot a demand zone on EUR/USD and your stop-loss sits 25 pips below your entry.

To risk ₦4,000 over 25 pips, your position size works out to about 0.06 lots on this account (each pip is worth roughly ₦160). If the zone holds and price runs 50 pips to the next supply zone, you make around ₦8,000. If it breaks and stops you out, you lose the ₦4,000 you planned for. Nothing more. That's the entire point of sizing before you enter: the zone might fail, and your account survives when it does.
Supply and Demand Zones vs Order Blocks
What Is an Order Block?
An order block is a close cousin of a zone, popularised by smart money concepts traders. It's usually defined as the last opposing candle before a strong move: the last down candle before a big rally, or the last up candle before a big drop. Where a zone is often a cluster, an order block is frequently a single candle.
Key Differences and When to Use Each
The difference is precision versus flexibility. An order block is tighter, one candle, so your stop can be smaller and your risk-to-reward better. A demand or supply zone is broader, giving price more room to react without stopping you out.

Neither is superior. Order block traders like the surgical entries; zone traders like the buffer. Many traders combine both: use the zone for context, then refine the exact entry to the order block candle inside it. Start with zones if you're new. They're more forgiving while you learn to read imbalance.
Managing Risk When Trading Zones
Why No Zone Is Guaranteed to Hold
A trader in Lagos marks a beautiful demand zone, places a buy, and watches price slice straight through it into a 60-pip loss. Was the zone wrong? Maybe. Or maybe news hit, or the trend was against it, or those resting orders were already filled on an earlier test. Zones express probability, not prophecy. Even a textbook zone fails a meaningful share of the time, which is exactly why your stop-loss is non-negotiable.
Combining Zones With Other Confirmation
A zone on its own is a decent signal. A zone that lines up with the higher-timeframe trend, sits at a round number, and shows a rejection candle on arrival is a much better one. Stack confirmations and you trade fewer setups but higher-quality ones.
Don't overload the chart with ten indicators, though. Two or three confluences are plenty. More than that and you'll talk yourself into or out of every trade.
Start Practising Supply and Demand Trading With Rally Trade
Reading about supply and demand zones is one thing; marking them on live charts is where it clicks. Open an MT5 trading account through Rally Trade, load a major pair like EUR/USD, and start drawing zones on the 4-hour chart. Open a free demo account first so a mistake costs you nothing but time.
With Naira deposits from $100, crypto funding options, and in-person seminars across Nigerian cities, you can build the skill without guessing your way through it alone. Start small, size every position before you enter, and let each zone prove itself.
Trading carries significant risk and won't suit every investor. Past performance tells you nothing guaranteed about future results. Never commit money you can't afford to lose, and make sure you genuinely understand how leveraged products work before you put capital on the line.
Frequently Asked Questions
What are supply and demand zones in forex?
×
Supply and demand zones are price areas where large buying or selling once overwhelmed the market, causing a sharp move. A demand zone marks where buyers pushed price up strongly, while a supply zone marks where sellers drove price down. Traders watch these zones because leftover orders may cause price to react again when it returns.