Doji Candlestick Pattern: What It Means & How to Trade It
A doji candlestick forms when price opens and closes at nearly the same level — a clear sign of market indecision. Learn the main types (gravestone, dragonfly, long-legged) and how to trade them with confirmation.

What Is a Doji Candlestick?
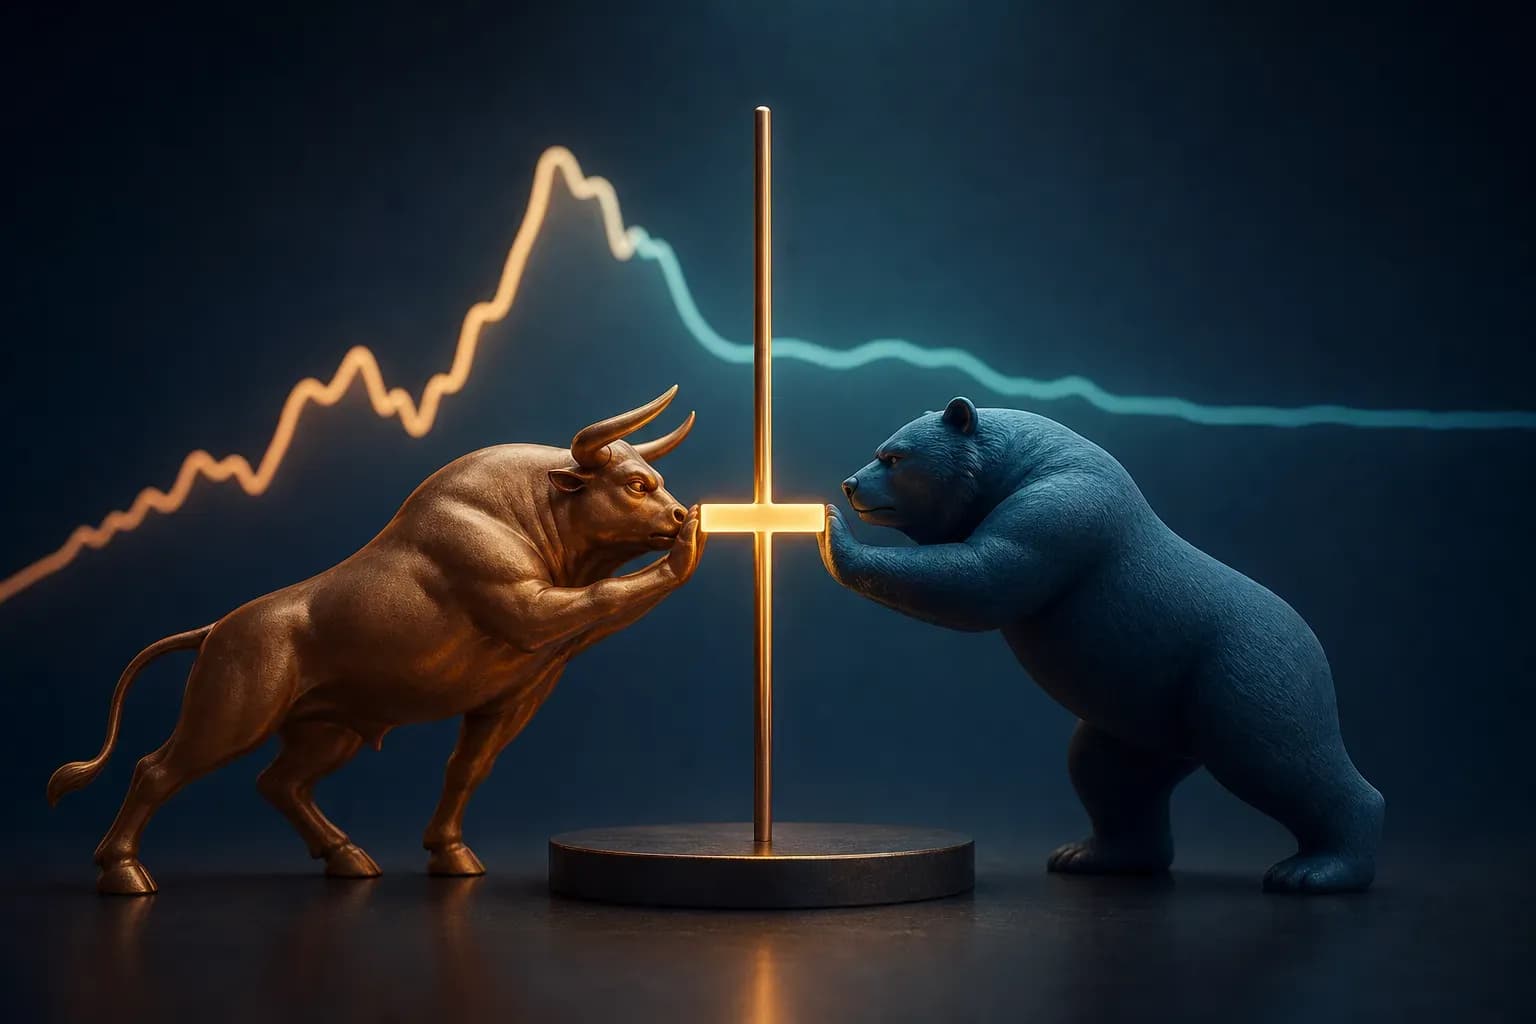
A candle that opens and closes at almost the same price is telling you something: nobody won that session. That's a doji candlestick, and it's one of the most talked-about single-candle patterns in technical analysis. Buyers pushed. Sellers pushed back. When the dust settled, price ended up roughly where it started.
The word "doji" comes from Japanese candlestick charting, where it describes a candle with little to no body. On EUR/USD, GBP/USD, gold, or Bitcoin, a doji looks like a thin cross or a plus sign. The wicks (the lines above and below) can be long or short, but the body stays tiny.
How a Doji Forms on the Chart
Picture a one-hour candle on USD/JPY. Price opens at 149.80, spikes up to 150.40, falls back to 149.30, then drifts to close at 149.82. Open and close are two pips apart. On the chart, that entire hour of struggle collapses into a single narrow candle with wicks poking out both sides.

The body reflects the net result (open versus close), not the range. That's the whole point. A candle can travel 100 pips during the session and still print a doji if it lands back near its opening price. The market moved a lot and decided nothing.
Technically, a "true" doji has an identical open and close. In practice, most traders accept a body that's a small fraction of the total range, say under 5-10%. Rigid definitions matter less than what the candle represents.
Why a Doji Signals Market Indecision
Momentum stalls when a doji forms. In a strong uptrend, candles usually show solid green bodies as buyers keep lifting price. Then a doji appears. Suddenly the buyers who dominated for hours can't close the candle higher than where it opened. That hesitation is the signal.
Indecision isn't a forecast on its own, though. It's a pause, and pauses can resolve either way. A doji after a long rally might mean buyers are exhausted and a reversal is coming. Or it might just be the market catching its breath before continuing. Context decides everything, which is why traders who act on the doji alone tend to get chopped up.
The Main Types of Doji Patterns
Not every doji carries the same message. The position of the wicks changes the story, and four variations show up often enough to know by name.

Standard Doji
The classic version has a small body sitting near the middle of the candle, with roughly equal wicks above and below. It's a clean picture of balance: buyers and sellers fought to a draw with neither controlling the extremes.
A standard doji in the middle of a choppy range means very little. The same candle at the peak of a three-day rally on gold means a lot more. Location is doing most of the work.
Gravestone Doji
The gravestone doji has a long upper wick, almost no lower wick, and a body pinned near the bottom of the candle. It looks like a capital T.
Here's what it tells you. Price opened, buyers drove it sharply higher during the session, then sellers came in and slammed it all the way back down to the open. Every bit of buying got rejected. When a gravestone doji appears at the top of an uptrend, it often points to weakening bullish momentum and a possible reversal lower. It's considered one of the more bearish-leaning doji shapes, though it still needs the next candle to confirm.
Dragonfly Doji
Flip the gravestone and you get the dragonfly doji: long lower wick, minimal upper wick, body sitting near the top. It forms a capital T standing on its head.
The dragonfly shows sellers pushing price down hard during the session, only for buyers to reclaim all the lost ground and close near the open. Appearing at the bottom of a downtrend, it can hint that selling pressure is drying up. Traders read it as a potential bullish reversal signal. Same rule applies as always. One candle isn't a strategy.
Long-Legged Doji
The long legged doji has extended wicks on both sides and a small body somewhere in between. This is indecision on steroids. Price swung violently up and down, covered a wide range, and still finished near where it began.
You'll often see a long-legged doji around major news, like a US Non-Farm Payrolls release at 1:30pm WAT, when price whipsaws in both directions before settling. It signals genuine confusion in the market. Big moves, no conviction.
What a Doji Signals in Context
The same doji means different things depending on where it lands. This is the part most beginners skip, and it's the part that matters most.

Doji at the Top of an Uptrend
A trader watching GBP/USD sees six consecutive green candles on the 4-hour chart. Then a doji, right at the top. That doji is the market whispering that buyers are running out of steam after the run-up. If the next candle closes red and firm, the odds of a pullback or reversal increase. A gravestone doji in this spot is an even stronger warning.
Doji at the Bottom of a Downtrend
At the base of a sustained sell-off, a doji suggests sellers are losing grip. A dragonfly doji is especially telling here, since it shows buyers stepping in to reject lower prices. But a doji in a falling market isn't a green light to go long. Downtrends can pause, print a doji, and keep falling. Wait for proof.
Doji in a Sideways or Ranging Market
In a flat, choppy market, dojis lose most of their meaning. Price is already indecisive, so a candle showing indecision adds nothing. You'll see dojis scattered all through a range like USD/CHF grinding sideways for days. Trading each one is a fast way to bleed your account on spread and noise. Ignore them until price reaches the edge of the range, near clear support or resistance.
How to Trade a Doji Candlestick
Why the Doji Needs Confirmation
A doji is a heads-up, not a trade trigger. Acting the moment one prints means you're betting on indecision resolving in your favour, which is a coin flip.
Confirmation means waiting for the next candle to show direction. Doji at the top of an uptrend? Wait for a red candle that closes below the doji's low before considering a short. Doji at a downtrend bottom? Wait for a green candle closing above the doji's high before thinking about a long. That one extra candle filters out a large chunk of false signals.
Using Support, Resistance and Volume
Confirmation gets stronger when the doji lines up with a level that already matters. A doji forming exactly at a resistance zone where price reversed twice before carries far more weight than one in open space.
Volume adds another layer. A long-legged doji on heavy volume shows a genuine battle between big buyers and sellers. The same candle on thin volume is mostly noise. On crypto pairs like BTC/USD, a doji at a well-tested support level with rising volume is worth watching closely. In isolation, it's just a shape.
Placing Stops and Managing Risk
Set your stop before you enter, based on the doji's structure. If you're going short after a bearish confirmation, a logical stop sits just above the doji's high. Going long after a bullish confirmation, place it below the doji's low.

Never risk more than a small, fixed percentage of your account on a single doji-based trade. Many traders cap it at 1-2%. On a ₦200,000 account, 1% is ₦2,000 of risk. Size your position so a stop-out costs you that and no more, whatever the pip distance. This is what keeps one bad read from turning into a serious dent.
Doji Trading Example and Common Mistakes
A Step-by-Step Example (Naira Chart)
A trader funds a Rally Trade account with the ₦-equivalent of $200 and watches EUR/USD on the 1-hour chart during the London session. Price has climbed steadily for eight hours. At resistance around 1.0950, a gravestone doji prints: long upper wick, tiny body at the bottom.

She doesn't sell yet. She waits. The next candle opens and closes red, finishing below the doji's low at 1.0930. That's her confirmation. She enters short, places a stop just above the gravestone's high at 1.0965, and targets the previous support around 1.0880. Risk: 35 pips. Reward: roughly 50 pips. If it works, good. If price reclaims 1.0965, she's out for a controlled, pre-planned loss and moves on.
Mistakes to Avoid When Trading Doji Patterns
Trading every doji is the biggest error. Dojis are common, especially on lower timeframes, and most of them are meaningless noise. Chasing each one racks up spread costs and losing trades.
Don't ignore the trend the doji sits in, either. A doji only signals a possible reversal when there's an established trend to reverse. And skipping confirmation to "get in early" is how beginners get caught on the wrong side when indecision resolves against them.
The Doji Among Other Candlestick Reversal Patterns
The doji belongs to a broader family of candlestick reversal patterns, and it's rarely the strongest on its own. Patterns like the engulfing candle, the hammer, and the evening star carry more conviction because they show a clear shift, not just a pause.
Where the doji earns its keep is as an early warning. It flags hesitation before a bigger reversal pattern completes. A gravestone doji followed by a bearish engulfing candle at resistance is a much more compelling setup than either alone. Think of the doji as the first hint, with confirmation and confluence doing the heavy lifting.
Start Applying What You've Learned on Rally Trade
Reading about the doji candlestick is one thing; spotting a live gravestone doji at resistance is another. The gap closes with screen time. Open a chart, mark your support and resistance levels, and watch how dojis behave at those points before you ever risk money on one.
Rally Trade offers MT5 trading platform you can download and install on your mobile devices, where you can study these patterns across forex, crypto, indices, and commodities, with Naira deposits starting from $100. Practise identifying the standard, gravestone, dragonfly, and long-legged doji in context, wait for confirmation, and keep your risk fixed and small while you build the skill.
Trading carries significant risk and won't suit everyone. Past performance tells you nothing guaranteed about future results. Only commit money you can genuinely afford to lose, and make sure you understand how leveraged products work before you put capital on the line.
Frequently Asked Questions
What does a doji candlestick mean in trading?
×
A doji candlestick means the market opened and closed at nearly the same price, showing indecision between buyers and sellers. It signals that neither side controlled the session, which can hint at a pause or a potential reversal. On its own, a doji is not a prediction — its meaning depends heavily on where it appears on the chart.